


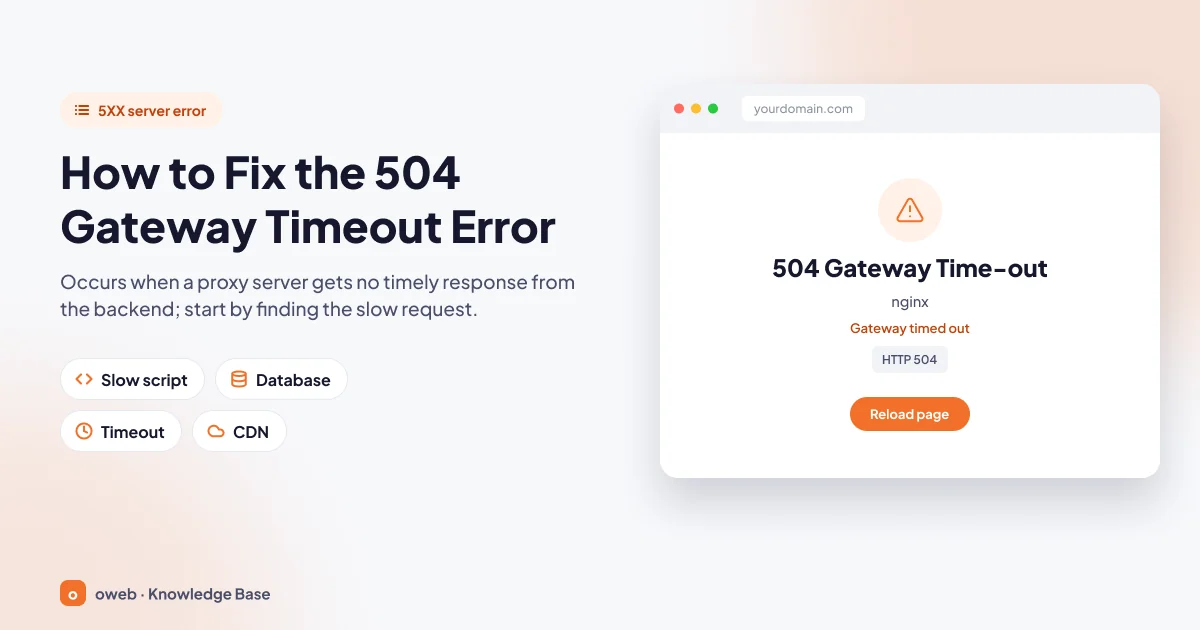
A 504 Gateway Timeout error means that a server acting as a gateway or proxy did not receive a timely response from the backend server it needed to complete the request. To fix it, first use the error logs to find the request that is slowing down, then fix the script, the database query or the relevant timeout setting.
Summary
- A 504 is a server-side 5xx error; in most cases it has nothing to do with the visitor's device.
- The error is generated by the layer in front of the backend: a CDN, a reverse proxy, a load balancer or the web server (Nginx, Apache).
- The most common causes are slow PHP scripts, long-running database queries, exhausted PHP workers, unresponsive external APIs and low timeout values.
- In Nginx,
proxy_read_timeoutandfastcgi_read_timeoutdefault to 60 seconds; in PHP,max_execution_timedefaults to 30 seconds. - Raising the timeout is the last step, not the first; find the cause of the slowdown first.
- On Cloudflare, 504 and 524 are not the same: with a 524, it is Cloudflare itself that waits and runs out of time.
- Prolonged 5xx errors can make Google slow down crawling and, over time, drop pages from the index.
What is a 504 Gateway Timeout error?
504 Gateway Timeout is a 5xx-class HTTP status code indicating that a server acting as a gateway or reverse proxy did not receive a response from the server behind it within the allowed time. In most cases this error does not mean the site is down; it means the response was delayed.
To understand the cause, it helps to look at how a page is built. The request leaves the browser, passes through a CDN if there is one, reaches the web server (Nginx or Apache), goes from there to PHP-FPM, which runs PHP, and finally extends to the database or an external service. Every layer in this chain that hands the request on to the next one acts as a gateway or reverse proxy. For the basics, see our article what a server is and how it works.
The HTTP standard, RFC 9110, defines the 504 code as follows: the server, while acting as a gateway or proxy, did not receive a timely response from the upstream server it needed to access in order to complete the request. This happens in four steps:
- The browser sends the request.
- The proxy layer forwards the request to the backend and starts a timer.
- The backend (PHP, the database, the application) cannot respond before the time runs out.
- The proxy stops waiting and returns a 504 response to the visitor.
A 504 does not necessarily mean that the backend server is down. In most cases the backend is running; its response has simply taken longer than the layer in front of it is willing to wait. According to MDN, a 504 can have many causes, and fixing it usually requires investigation on the server side.
What does a 504 error look like?
The format of the message depends on which software generated the response; the look of the page tells you which layer to investigate.
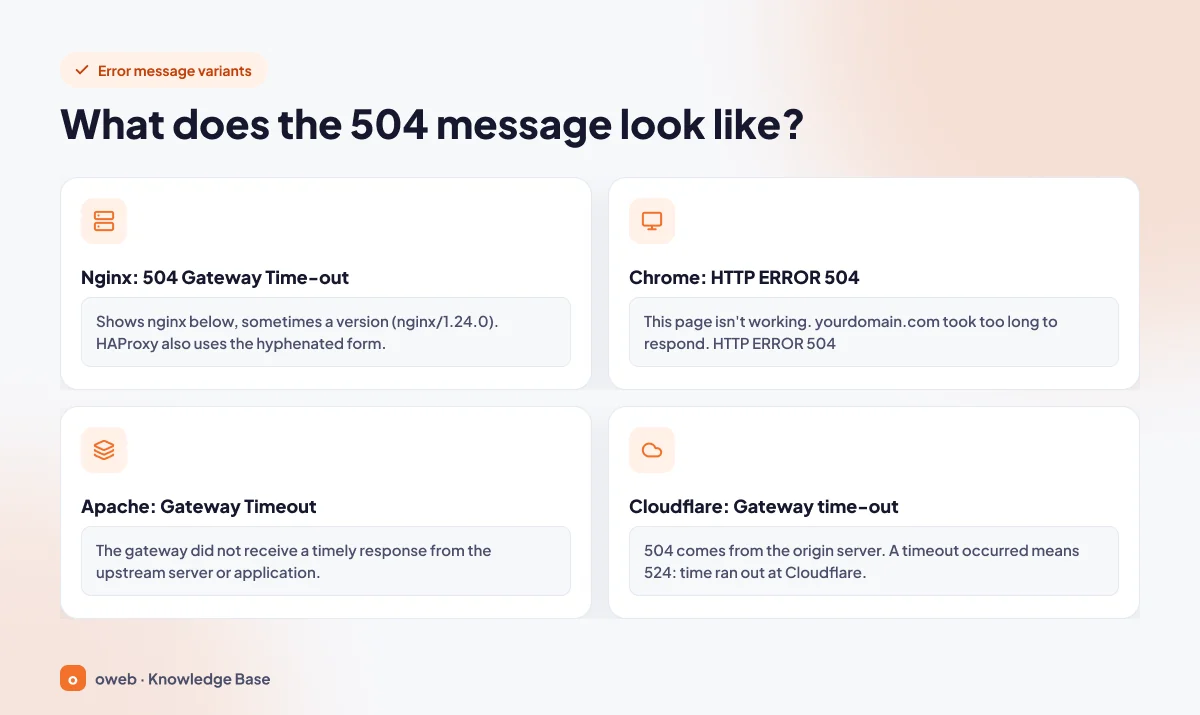
- Nginx: “504 Gateway Time-out” appears in the middle of the page with “nginx” below it. The hyphenated spelling behind searches for Nginx 504 Gateway Time-out is a holdover from the old HTTP/1.1 specification (RFC 2616) and lives on in software such as Nginx and HAProxy; the official reason phrase in the current standard (RFC 9110) is “Gateway Timeout” without the hyphen.
- Chrome: When the server sends a 504 response without a body (no content), the browser shows its own page: “This page isn’t working”, “yourdomain.com took too long to respond.” and “HTTP ERROR 504”.
- Apache: Under the “Gateway Timeout” heading you will see the sentence “The gateway did not receive a timely response from the upstream server or application.”
- Cloudflare: A Cloudflare-branded page shows the heading “Gateway time-out” and the 504 error code (“Error code 504” or “Error 504”, depending on the page design). If the heading is “A timeout occurred” and the code is 524, the situation is different; we explain the difference below.
What causes a 504 error?
All causes share one common denominator: a process on the backend has taken longer than the wait time of the layer in front of it. These are the six most common causes on sites returning a 504 error:
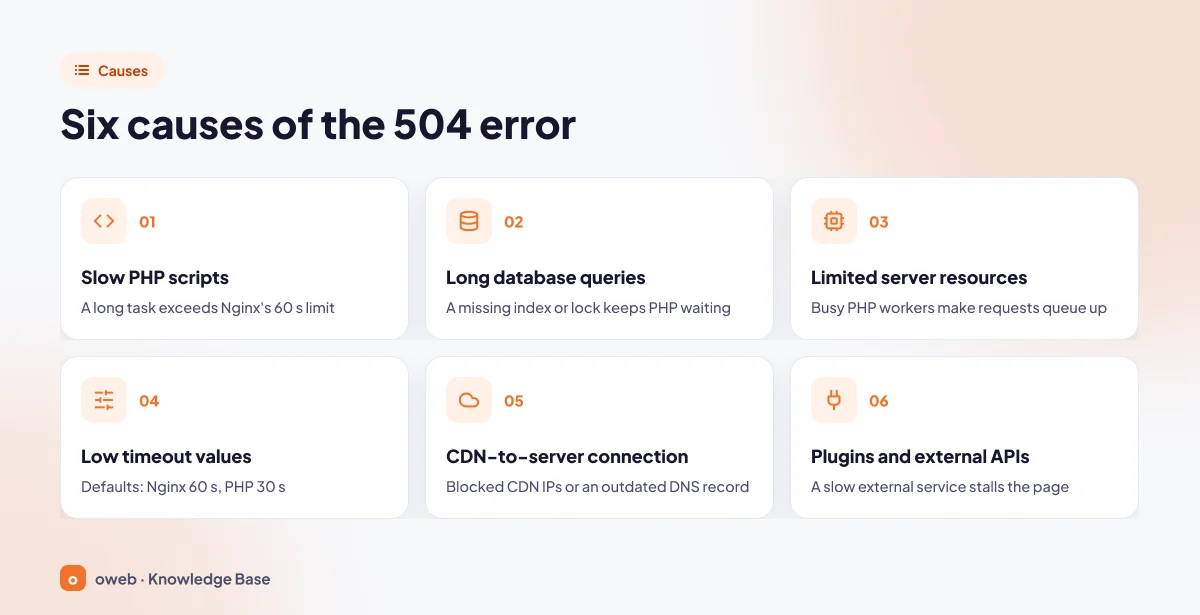
Slow PHP scripts
Bulk email sending, a large export, image processing or report generation can take minutes rather than seconds when run inside a single request. By default, Nginx waits 60 seconds for a response from the backend. If the script sends no data within that time, Nginx closes the connection and returns a 504.
Long-running database queries
Large tables with missing indexes or locked queries keep PHP waiting. A frequently overlooked detail: according to the PHP manual, max_execution_time measures only the script's own execution time; on systems other than Windows, time spent on database queries, stream operations and system calls is not counted. (Exception: ZTS builds of PHP 8.3 and later measure the actual elapsed time.) So on most installations PHP can wait minutes for a query response without hitting its own 30-second limit; it is the proxy layer in front that runs out of time and returns the error.
Insufficient server resources
When the CPU or memory is saturated, or when all PHP-FPM workers are busy, new requests wait in a queue. In PHP-FPM, pm.max_children limits how many requests can be processed at the same time. If a queued request cannot be processed before the proxy's time runs out, the result is again a 504. Traffic spikes and heavy bot crawling can cause this situation.
Low or mismatched timeout values
The timeout values of the layers are independent of each other: in Nginx, proxy_read_timeout and fastcgi_read_timeout are 60 seconds; in Apache 2.4, Timeout is 60 seconds (300 on cPanel servers); in PHP, max_execution_time is 30 seconds. A job that genuinely needs 90 seconds will end in a 504 every time because of a 60-second proxy limit, while the process on the backend often keeps running. Reverse proxies and load balancers have similar wait limits as well.
The connection between the CDN and the origin server
If the firewall on the server blocks the CDN's IP addresses or applies rate limits to them, the CDN cannot reach the origin server. Timeouts also occur when the DNS record in the CDN dashboard still points to the old IP after the server has been migrated or its IP address has changed. Cloudflare reports most of these situations with code 522; load balancers and other proxy services may show the same situation as a 504.
Heavy plugins and external API calls
Plugins that connect to a payment, shipping or license verification service while the page loads slow your site down whenever the other side slows down. The default timeout in the WordPress HTTP API is 5 seconds, but plugins can raise this value. Several slow calls in a row can push the total time above the proxy limit.
What is the difference between 502, 503 and 504?
All three are server-side errors, but each one tells you something different. Because they are often confused, we have also added Cloudflare's own 524 code to the table:
| Code | Meaning | Typical cause | Where to look first |
|---|---|---|---|
| 502 Bad Gateway | The proxy received an invalid response from the backend | Crashed or stopped PHP-FPM, refused connection | Status of the backend service |
| 503 Service Unavailable | The server cannot handle the request due to temporary overload or maintenance | Maintenance mode, server resource limit, heavy load | Server resource usage, maintenance status |
| 504 Gateway Timeout | The proxy did not receive a timely response from the backend | Slow script, slow query, low timeout | Error log and the slow request |
| 524 (Cloudflare-specific) | Cloudflare connected to the origin server but did not receive an HTTP response in time | Long process exceeding Cloudflare's limit | The long-running request |
In short, with a 502 Bad Gateway error the response that arrives is broken or the connection has dropped; with a 504, no response arrived at all within the time limit. In Nginx, you see a 504 if the backend does not respond in time, and a 502 if the connection is refused or dropped. For details on the 503 Service Unavailable code, see our 503 Service Unavailable error guide.
What can you do about a 504 error as a visitor?
A 504 is generated on the server side; clearing the browser cache or restarting your modem usually does not change the result. Still, try the following:
- Wait a minute or two and refresh the page. If you got the error during a payment or form submission, first check whether the transaction went through; the process on the backend may have completed.
- Open the site from a different network, such as mobile data, or from another device.
- If you use a VPN or a proxy server, turn it off and try again.
- If the problem persists, tell the site owner the address and the time at which you saw the error.
How do you fix a 504 error as a site owner?
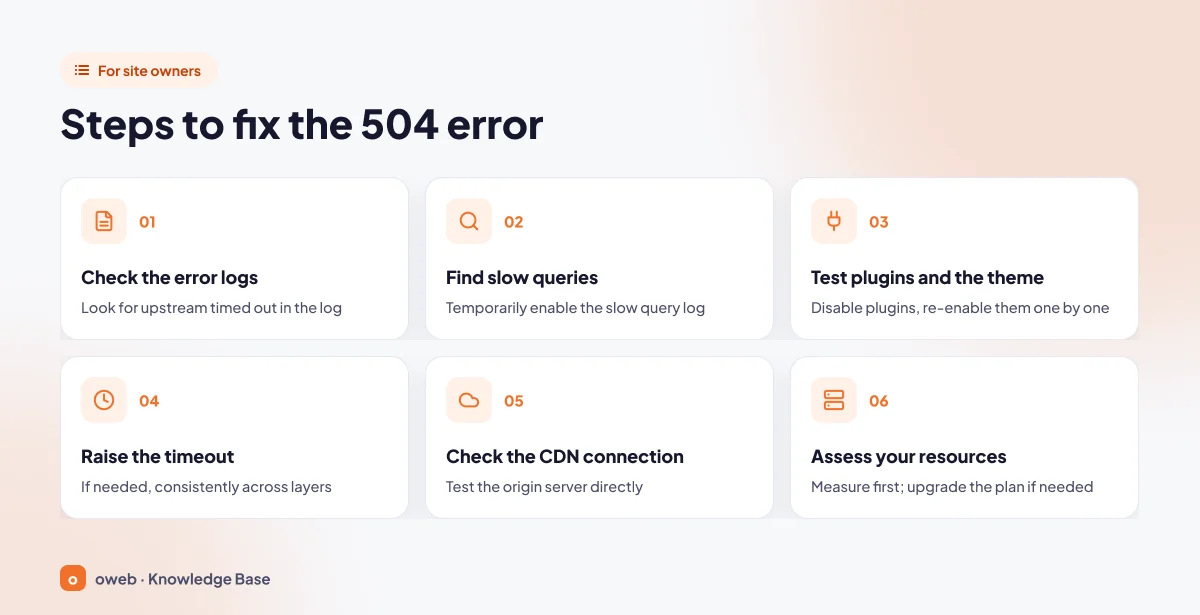
A lasting 504 error fix is found by measuring, not guessing. The steps are ordered from the simplest and least risky to the most advanced:
- Find the request that timed out in the error logs.
- Identify slow database queries.
- Test plugins and the theme one by one.
- If necessary, increase timeout values consistently across the layers.
- Check the connection between the CDN and the origin server, as well as the firewall.
- Measure server resource usage and upgrade your plan if it is insufficient.
Before editing files, the database, the server configuration or DNS records, take a full backup and note down every value you change, so you can roll back to the previous state if needed.
Before you start: When does the error appear, and which layer generates it?
First, look at when the error appears; the way the error shows up often gives away its cause:
| When does the error appear? | Possible cause |
|---|---|
| Only in the admin dashboard | admin-ajax requests, heavy plugin screens |
| On a single URL | A slow query or external API call on that page |
| At certain times of day | Scheduled tasks, backups, traffic peaks |
| During an import, update or backup | A long-running process in a single request |
| Across the whole site, all the time | Insufficient server resources, a service problem, the CDN connection |
Next, use the terminal to see which layer returns the response and how long it takes (on Windows, use curl.exe and write NUL instead of /dev/null):
curl -sI https://yourdomain.com/
curl -o /dev/null -s -w "%{http_code} %{time_starttransfer}\n" https://yourdomain.com/
In the output of the first command, the server: cloudflare and cf-ray HTTP headers show that the response passed through Cloudflare, while Server: nginx or Apache indicates that the response most likely came directly from your server. The second command prints the status code and how many seconds it took for the first byte to arrive.
1. Check the error logs
In the Nginx error log (/var/log/nginx/error.log on most installations), a 504 leaves this line behind:
upstream timed out (110: Connection timed out) while reading response header from upstreamThe request and upstream fields further along the line show which URL and which backend timed out. On Apache servers using PHP-FPM, the same situation appears as AH01075: Error dispatching request and The timeout specified has expired entries.
- cPanel: The Metrics > Errors screen lists the last 300 entries in the web server error log. If the server runs Nginx, this screen shows only the errors from the Apache logs.
- Plesk: The Domains > yourdomain.com > Logs screen shows the domain's web server logs.
- PHP-FPM: With the
request_slowlog_timeoutandslowlogsettings, the server administrator can have the PHP backtrace of requests exceeding a set duration written to the slow request log.
2. Find slow queries
In MySQL and MariaDB, the slow query log is disabled by default, and long_query_time defaults to 10 seconds. If you have administrator privileges, enable the log temporarily:
SET GLOBAL slow_query_log = 1;
SET GLOBAL long_query_time = 2;
You can summarize the entries with mysqldumpslow in MySQL and mariadb-dumpslow in MariaDB. On shared hosting you will not have access to this setting; in WordPress, a debugging plugin such as Query Monitor shows slow queries and external HTTP calls page by page. Turn off the log and the plugin once you have finished investigating.
3. Test plugins and the theme
If the error started after installing a new plugin or after a plugin update, deactivate that plugin first. If you are not sure, follow WordPress's official troubleshooting order: deactivate all plugins, and if the problem goes away, reactivate them one by one to find the culprit, then try with a default theme. If you cannot access the dashboard, use WP-CLI over SSH:
wp plugin deactivate --allIf you do not have SSH access, temporarily renaming the wp-content/plugins folder in the file manager also deactivates all plugins. If possible, run the test on a staging copy of the site or at a time when there are few visitors.
4. Increase timeout values deliberately
This step comes after you have found the cause of the slowdown and decided that the process genuinely needs to take a long time. Writing 600 seconds everywhere hides the problem, keeps PHP workers busy for longer and makes things worse at peak times. You can find which setting is changed where in the “Timeout settings” section below.
5. Check the CDN and the firewall
Before disabling the CDN, test the origin server directly. The command below sends the request directly to the server IP address without touching DNS, and prints the status code and how many seconds it took for the first byte to arrive:
curl -s -o /dev/null -w "%{http_code} %{time_starttransfer}\n" --resolve yourdomain.com:443:SERVER_IP https://yourdomain.com/If the origin server responds quickly, the problem lies between the CDN and the origin server: verify that the firewall is not blocking the CDN's IP ranges and that the DNS record in the CDN dashboard points to the current server IP. If the origin server is slow too, the problem is in the server itself.
If your server's firewall only allows the CDN's IP ranges, this test cannot connect; that does not mean the origin server is faulty. In that case, run the test from inside the server itself (over SSH) or ask your hosting support to run it. We explain how to test by pausing Cloudflare below.
6. Evaluate server resources and upgrade if necessary
If you still regularly hit the CPU, memory or PHP worker limit after optimizing your code and queries, your plan is too small for your site. First reduce the load with caching and an up-to-date PHP version; you can find the steps for changing the PHP version in a separate guide. If the measurements do not change, moving to a plan with more resources or to a VDS virtual server with dedicated resources is the lasting solution.
Timeout settings: Which value changes in which layer?
The rule for timeout settings is simple: the limit of an inner layer should not be greater than that of an outer layer (PHP ≤ PHP-FPM ≤ web server or proxy ≤ CDN). The error the visitor sees depends on which timer runs out first: if Nginx's wait time runs out first, you see a 504; if PHP-FPM terminates the request earlier through request_terminate_timeout, Nginx usually reports it as a 502. That is why you should adjust these values together and consistently, not one at a time.
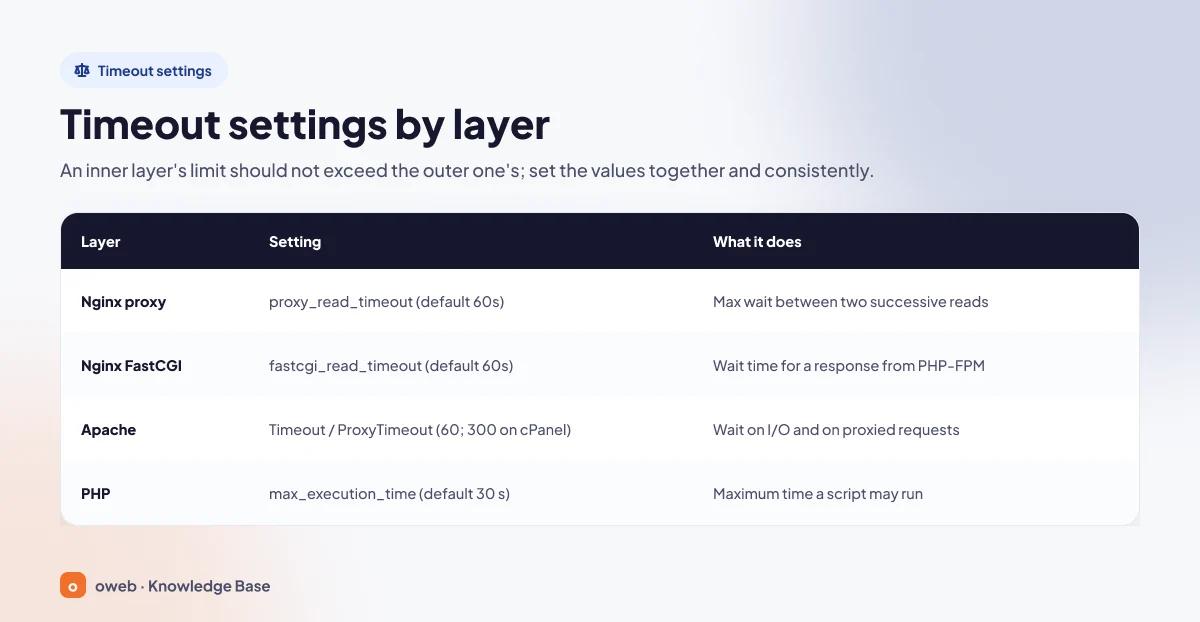
| Layer | Setting | Default | What it does |
|---|---|---|---|
| Nginx proxy | proxy_read_timeout | 60s | Maximum wait time between two successive reads when reading a response from the proxied server |
| Nginx FastCGI | fastcgi_read_timeout | 60s | Time to wait for a response from a FastCGI server such as PHP-FPM |
| Apache | Timeout / ProxyTimeout | 60 (300 on cPanel); ProxyTimeout inherits the Timeout value | Wait time for I/O and proxy requests |
| PHP | max_execution_time | 30 (0 on the command line) | Maximum time a script is allowed to run (in seconds) |
In PHP-FPM, request_terminate_timeout defaults to 0, meaning it is disabled. On servers running LiteSpeed, ask your hosting provider about timeout settings.
How do you increase the timeout in Nginx?
To fix a 504 in Nginx, raise fastcgi_read_timeout on sites using PHP-FPM, or proxy_read_timeout on setups that pass the request to another server (reverse proxy), in the relevant server or location block; then test with nginx -t and load the change with nginx -s reload.
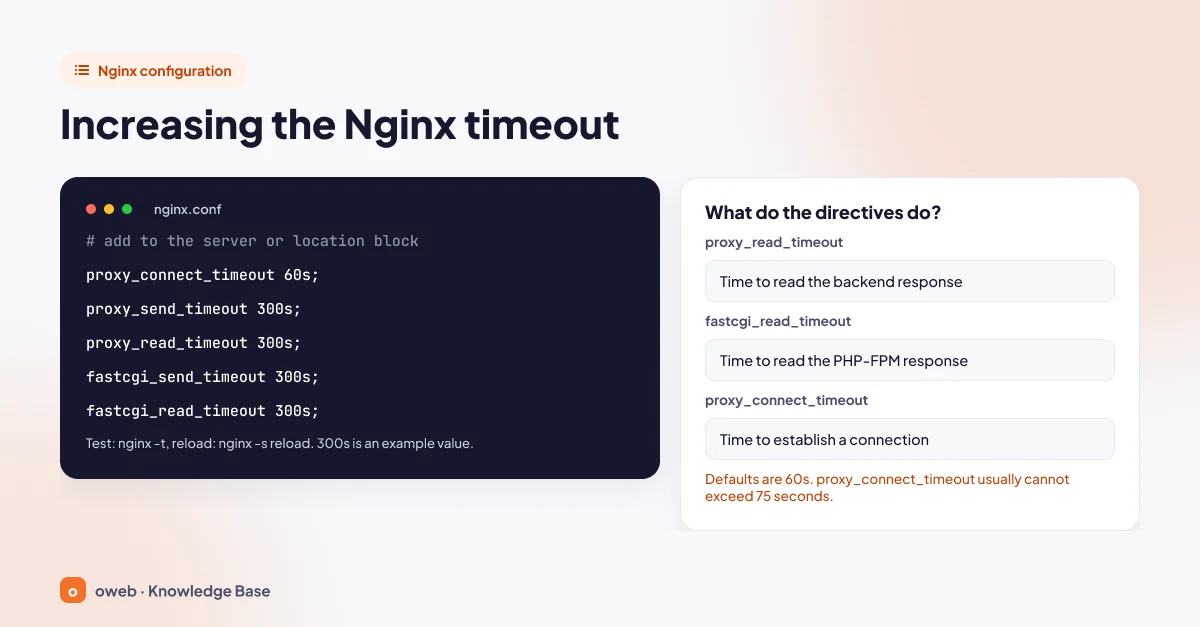
location / {
    proxy_pass http://127.0.0.1:8080;
    proxy_connect_timeout 60s;
    proxy_send_timeout 300s;
    proxy_read_timeout 300s;
}

location ~ \.php$ {
    include fastcgi_params;
    fastcgi_pass unix:/run/php/php-fpm.sock;
    fastcgi_send_timeout 300s;
    fastcgi_read_timeout 300s;
}
The address, the socket path and the 300-second value are examples; keep the lines in your own configuration and add only the timeout directives. The directives are valid in the http, server and location contexts.
If your site is behind Cloudflare and you are not on the Enterprise plan, raising the time on the origin server above 125 seconds makes no difference for visitors; they will see a 524 instead of a 504. Move jobs that long to the background or to a subdomain that does not go through the Cloudflare proxy.
Which directive applies to which setup?
If Nginx passes the request to Apache or a Node.js application, the proxy_* directives apply; if it runs PHP directly through PHP-FPM, the fastcgi_* directives apply. Raising a value in the wrong group changes nothing. proxy_connect_timeout covers only the time to establish a connection and usually cannot exceed 75 seconds; raising it does not resolve a 504 in most cases.
Test and load the change
nginx -t
nginx -s reload
Run the commands with root privileges (prefixing them with sudo if necessary); the first command checks the syntax, the second reloads the configuration. If the test returns an error, do not reload.
On servers using Plesk
In Plesk, directives are entered line by line, without opening a block (for example proxy_read_timeout 180s;), in the “Additional nginx directives” field on the Websites & Domains (Domains in the administrator view) > yourdomain.com > Apache & nginx Settings screen (found under the Hosting & DNS tab in recent versions). Only the Plesk administrator can see and edit this field; it is not visible in customer accounts.
How do you set Timeout and ProxyTimeout in Apache?
In Apache, both directives go into the main server configuration or the relevant virtual host block; they cannot be used in .htaccess. In Apache 2.4, Timeout defaults to 60 seconds; if ProxyTimeout is not set, it uses the Timeout value.
Timeout 120
ProxyTimeout 120
The values are examples. After making the change, test the syntax with apachectl configtest, and if there are no errors, reload the configuration with apachectl -k graceful.
On cPanel and WHM servers
The cPanel default for the Timeout field on the WHM > Service Configuration > Apache Configuration > Global Configuration screen is 300. On cPanel servers using PHP-FPM, ProxyTimeout also defaults to 300 seconds; since the default is already high, do not lower it. If you change the Timeout field, save it; the change takes effect once the configuration is rebuilt and Apache is restarted.
On cPanel servers, the ProxyTimeout line can be added to an include file under /etc/apache2/conf.d/includes/, Apache's additional configuration directory (for example via the “Pre Main Include” section of the Include Editor screen in WHM); Apache is then restarted with /usr/local/cpanel/scripts/restartsrv_httpd. These settings require root privileges; on shared hosting, request them from the support team.
How do you increase max_execution_time in PHP?
In PHP, the max_execution_time value is increased with the MultiPHP INI Editor in cPanel, or with a .user.ini file if no panel tool is available. The default value is 30 seconds; on the command line (CLI) it is 0, meaning unlimited.
This is also the advantage of running long jobs with PHP's command-line version instead of the browser (over SSH, or with a cron job that runs a php or WP-CLI command directly): since the request does not pass through the web server, both this limit and the proxy timer drop out of the picture. Cron jobs that call a URL with wget or curl, on the other hand, are ordinary HTTP requests and are subject to the same timeouts.
cPanel: MultiPHP INI Editor
On the cPanel > Software > MultiPHP INI Editor screen, select the domain in the Basic Mode tab, enter the max_execution_time value and save with Apply. Your hosting provider may have disabled this interface.
With .user.ini or .htaccess
Add the following line to the .user.ini file:
max_execution_time = 120The .user.ini file is processed only if PHP runs as CGI/FastCGI; the change may take up to 5 minutes to take effect. If PHP runs as an Apache module, the same setting is written to the .htaccess file with the line php_value max_execution_time 120.
If PHP is not running as an Apache module (PHP-FPM or FastCGI), this line can cause a 500 Internal Server Error across the entire site. If you are not sure which method is in use, use the MultiPHP INI Editor or .user.ini instead of .htaccess; make a copy of the .htaccess file before editing it, and delete the line if you see an error.
Increasing only max_execution_time often does not resolve a 504. On most Linux installations, time spent waiting for the database and external services does not count toward this limit, so the error comes from the timer of the web server or the proxy.
What is the difference between Cloudflare 504 and 524 errors?
With a Cloudflare 504 error, the timeout is usually reported by a proxy on the origin server side and Cloudflare passes that response on; with a 524, it is Cloudflare itself that connected to the origin server and ran out of time. According to Cloudflare's documentation, a 504 page can have two sources:
- Cloudflare-branded error page: The 504 response was generated by your origin server, and Cloudflare is only passing it on. This is the most common case, and the fix is on the server side.
- Plain, unbranded 504 page: The error occurred on Cloudflare's side. In this case, the documentation recommends testing the compression (gzip) setting on the origin server.
A 524, by contrast, is not a standard HTTP code. Error 524 reports that Cloudflare successfully connected to the origin server, but the origin server did not return an HTTP response within the Proxy Read Timeout. As of November 2026, the default value of this timeout is 125 seconds, and it can only be increased on the Enterprise plan. The 100-second figure found in older articles is out of date.
For long jobs, Cloudflare recommends not stretching the timeout but running the process in the background and polling its status at intervals, or running requests that regularly exceed the timeout from a subdomain that does not go through the Cloudflare proxy (DNS only).
To test whether the problem comes from Cloudflare, you can use the Overview > Advanced Actions > Pause Cloudflare on Site option, or edit the relevant record on the DNS > Records screen and set its Proxy Status to Off. Development Mode only bypasses the cache; it does not turn off the proxy.
When Cloudflare is paused or a record is set to DNS only, WAF rules and Cloudflare SSL/TLS certificates are disabled, traffic goes directly to the origin server, and the origin server's IP address becomes visible in DNS lookups. If your server has only a Cloudflare Origin CA certificate, visitors will see an untrusted certificate warning. Keep the test short and turn the protection back on when you are done.
How do you fix a WordPress 504 error?
A WordPress 504 error usually appears during specific operations rather than across the whole site. To fix it, find the request returning the 504 (admin-ajax, wp-cron, an import), deactivate the responsible plugin and move long jobs to the system scheduler or the command line.
Why does admin-ajax.php return a 504 error?
admin-ajax.php handles background requests in the admin dashboard; when the server is slow or the PHP workers are full, these requests can end in a 504. The Heartbeat API sends requests to this address every 15 to 120 seconds from open tabs in the admin dashboard. Combine several open tabs with a slow server, and these requests can fill up the PHP workers. In the Network tab of your browser's developer tools, check which request returns the 504, and close dashboard tabs you are not using.
WP-Cron tasks
WP-Cron is not a real scheduler; it does not run continuously but is triggered by page loads. Unless it is disabled, WordPress fires WP-Cron on every page load. When heavy tasks pile up, the wp-cron.php request can take a long time and keep a PHP worker busy. The way to make this load predictable is to hook WP-Cron into the system task scheduler. First, add the following line to the wp-config.php file above the line /* That's all, stop editing! Happy publishing. */ (“Happy blogging.” in older installations; translated installations show a localized version of this comment):
define( 'DISABLE_WP_CRON', true );Then add the following command to the scheduled tasks (cron jobs) section of your hosting panel, for example to run every 15 minutes:
*/15 * * * * wget -q --delete-after https://yourdomain.com/wp-cron.php >/dev/null 2>&1The redirection at the end prevents an email notification from being sent on every run. Since this command calls the URL over HTTP, web server timeouts still apply. If you have SSH and WP-CLI access, running the following command from the WordPress directory in the cron job takes the work out of web server timeouts entirely:
wp cron event run --due-nowImports, backups and updates
Uploading a large file via Tools > Import, taking a full site backup or running bulk updates can take a long time in a single request. The WordPress documentation recommends splitting large import files into smaller pieces. If the process was cut off with a 504, do not restart it right away: part of the content may already have been created, and trying again can lead to duplicate entries.
Debug log
If you cannot find the responsible plugin, temporarily enable WordPress debug mode; add the lines to the wp-config.php file above the same comment line:
define( 'WP_DEBUG', true );
define( 'WP_DEBUG_LOG', true );
define( 'WP_DEBUG_DISPLAY', false );
Entries are written to the wp-content/debug.log file. When you are done, set WP_DEBUG back to false and delete the log file; it should not be left in a folder that is accessible from the web. A “loopback request” warning on the Tools > Site Health screen also indicates that scheduled tasks may not be able to run. If the site loads as a completely blank page, our WordPress white screen of death guide is a better starting point.
Does a 504 error affect SEO?
A short-lived 504 usually leaves no lasting mark; the real risk is the error persisting. According to Google's documentation, 5xx responses cause Google's crawlers (Googlebot) to temporarily slow down crawling. URLs already in the index are kept for a while, but if the error becomes persistent, they are eventually dropped from the index. Google does not give an exact time frame for this. Once the server starts returning successful responses again, the crawl rate gradually increases.
The Server error (5xx) reason in the page indexing report in Search Console and the host status in the Crawl Stats report show how often Googlebot runs into this error. For planned maintenance, the correct signal is a 503; according to the HTTP standard, a Retry-After header can be added to a 503 response.
Tips for preventing 504 errors
The following measures reduce the risk of a timeout by shortening processes on the backend:
- Use page caching and object caching; prevent every request from going all the way down to PHP and the database.
- Take long jobs such as imports, bulk email and backups out of the browser request and move them to the command line or to a cron job that runs PHP directly.
- Give external API calls short timeouts and cache their results.
- Enable and review the slow query log at regular intervals; add missing indexes.
- Rein in heavy bot crawling and request bursts with rate limiting.
- Set up an uptime monitoring tool so you see the error before your visitors do.
When should you contact hosting support?
If the error affects the whole site and is constant, if you cannot access the logs, or if an Nginx, Apache or PHP-FPM setting needs to be changed, do not wait. Including the following in your request speeds up the fix:
- The exact URL returning the error and the action that triggers it (such as an order, an import or a dashboard login)
- The date, time and time zone of the error
- A screenshot of the error page (is it Cloudflare-branded or Nginx-branded?)
- Recent changes: plugin, theme, PHP version, DNS or CDN settings
- The IP address you are connecting from
If you are an Oweb customer, you can open a support ticket with this information.
Frequently asked questions
Is the 504 error caused by me or by the site?
It is almost always caused by the site. A 504 is generated by a proxy on the server side. If the site opens for others and shows the error only for you, check your VPN, proxy server and DNS settings.
Does a 504 error go away on its own?
If it is caused by a momentary spike in load, it may clear up within a few minutes. If it keeps recurring on the same page or during the same operation, it will not go away on its own; the slow script, query or setting must be found and fixed.
What does HTTP ERROR 504 mean?
HTTP ERROR 504 is the code shown on Chrome's own error page for a 504 response. It means the same as 504 Gateway Timeout: a proxy on the server side did not receive a timely response from the backend.
What is the difference between Cloudflare 504 and 524 errors?
With a 504, the timeout is usually reported by a proxy on the origin server side, and Cloudflare passes that response on. With a 524, Cloudflare connected to the origin server but did not receive an HTTP response within the default 125-second limit (as of November 2026). A 524 is not a standard HTTP code but one specific to Cloudflare.
Why do I get a 504 during an update or import in WordPress?
These operations can take a long time in a single request, so they exceed the wait time of the web server or the proxy. Split large files into pieces, and before restarting the operation, check whether it was partially completed.
Does increasing the timeout value permanently fix a 504 error?
Only if the process genuinely needs to take a long time. If the slowdown is caused by a bad query or an unresponsive external service, extending the timeout merely postpones the problem and puts more strain on the server.
Can I change proxy_read_timeout myself on shared hosting?
Usually not. Nginx and Apache timeout directives are defined at the server level and require administrator privileges. In most cases you can only change PHP settings; for the others, contact hosting support.
Conclusion
A 504 Gateway Timeout error is not a cause but a consequence: one layer in the chain has given up waiting for the layer behind it. First determine which layer generates the error, find the slow request in the logs and fix the code or the query; touch timeout values only if necessary, and consistently across the layers. If you do not have access to the server settings, you can contact the Oweb support team.
